Ever looked at an ECG report and felt lost in a maze of squiggly lines? You’re not alone. These reports, while vital for understanding your heart health, can seem like a foreign language. For more information on ECG accuracy, see this article. This guide aims to simplify the basics of your ECG report, empowering you to discuss your heart health more confidently with your doctor. We’ll break down the key elements of an ECG in understandable terms, showing you what to look for, what it signifies, and, most importantly, why professional medical advice is indispensable. Let’s embark on this journey together to demystify those ECG lines!
Have you ever received an ECG report and felt overwhelmed by its complexity? Many people find these reports confusing, but this guide is designed to break down the essentials, helping you feel more informed and prepared when discussing your heart health with your healthcare provider. Let’s delve into the world of heart health, electrocardiogram interpretations, and diagnostic procedures.
What Exactly is an ECG?
An electrocardiogram (ECG or EKG) provides a snapshot of your heart’s electrical activity. It’s a painless, non-invasive test that measures the electrical signals driving your heart’s rhythm. Picture your heart as a sophisticated engine; the ECG reveals how its electrical components are functioning. These electrical signals orchestrate the contraction of your heart muscle, enabling it to pump blood efficiently throughout your body. The ECG captures these signals as a series of waves displayed on paper or a digital screen. It’s an insightful window into your heart’s operation!
The Heart’s Electrical Symphony: Deciphering the Waves
Think of your heart’s electrical activity as a detailed musical composition. The ECG serves as the sheet music, illustrating the rhythm and timing of each note. Specific segments of the ECG correspond to distinct stages in your heart’s cycle.
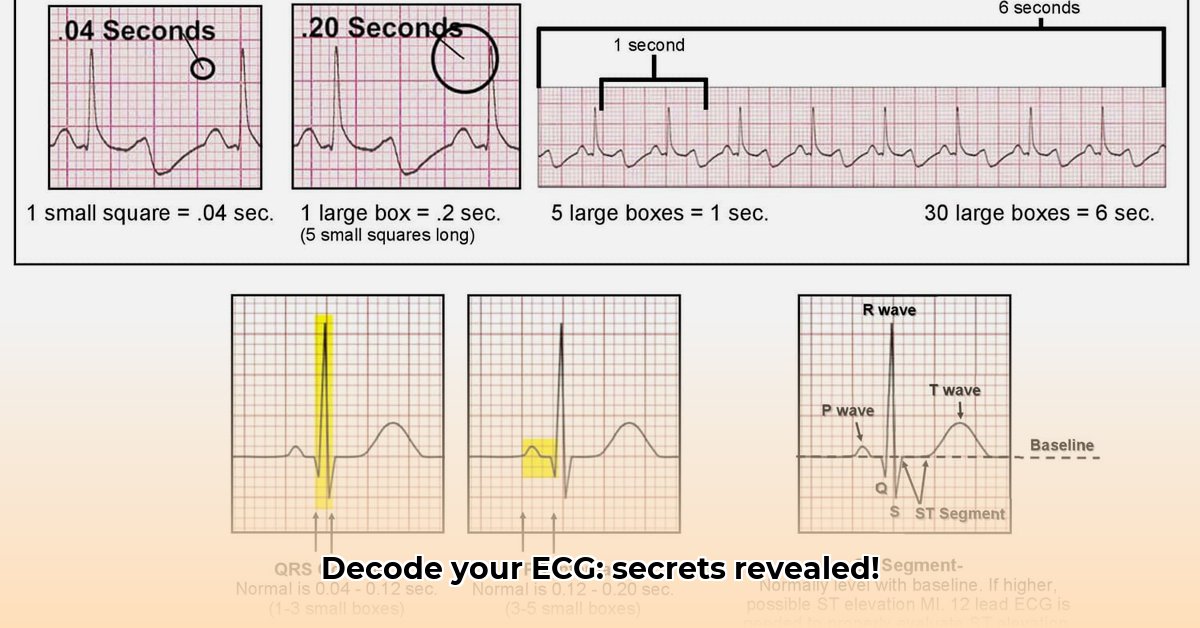
The P Wave: The Introductory Note. This small upward deflection represents the electrical impulse initiating the contraction of your atria – the upper chambers responsible for collecting blood before it’s pumped to the ventricles. It’s akin to the opening bars of a musical piece, setting the stage for the main performance.
The QRS Complex: The Core Melody. This prominent, sharp complex reflects the electrical activity as your ventricles – the heart’s powerful lower chambers – contract, propelling blood out to the body. This is the heart of the musical performance, the powerful and defining moment.
The T Wave: The Concluding Harmony. This more gradual wave illustrates the repolarization phase of your ventricles as they relax and prepare for the subsequent beat. It’s the gentle fade-out of the music, signaling the end of one phrase and the anticipation of the next.
Interpreting Your ECG Report: Beyond Just the Waves
Analyzing your ECG report involves more than simply identifying these waves. Here’s a breakdown of what you’ll typically encounter:
Heart Rate (HR): Measured in Beats Per Minute (BPM). This indicates the number of times your heart beats each minute. A normal resting heart rate generally falls between 60 and 100 bpm. If your heart rate lies outside this range, it warrants discussion with your doctor. Factors like fitness level, stress, and medications can influence heart rate.
Rhythm: The Consistency of the Beat. This describes the regularity of your heartbeat. Is it consistent and predictable, or are there any irregularities, such as skipped or extra beats? A consistent and steady rhythm is generally a favorable sign.
Intervals: The Significance of Timing. These represent the time spans between different components of the ECG waves. They provide insights into the speed at which electrical signals travel through your heart. Certain intervals, particularly the QT interval, are crucial for assessing ventricular repolarization, which is essential for preparing the heart for its next contraction. Prolonged or shortened QT intervals can indicate potential risks for arrhythmias.
Understanding What Your ECG Can Reveal: Normal vs. Abnormal Findings
This guide provides a foundational understanding of ECG interpretation, but it’s crucial to emphasize that you cannot use this information to self-diagnose. The purpose is to facilitate informed conversations with your doctor, not to substitute for professional medical expertise. Here are some general guidelines to consider:
A Normal ECG: This typically shows a consistent rhythm, a heart rate within the normal range (60-100 bpm), and waves with expected shapes. It suggests that your heart’s electrical system is operating efficiently, but it doesn’t guarantee the absence of all heart-related issues.
An Abnormal ECG: An irregular ECG may indicate various conditions, including irregular heartbeats (arrhythmias), reduced blood flow to the heart (ischemia), or even a heart attack (myocardial infarction). Variations in wave shapes, altered intervals, or irregular rhythms can signal potential problems. Accurate interpretation, however, always requires assessment by a qualified healthcare professional.
Why Professional Interpretation is Essential: Avoiding the Pitfalls of Self-Diagnosis
While this guide offers valuable insights, it only scratches the surface of a complex diagnostic process. Even slight variations on an ECG can have significant medical implications. Attempting to interpret the results independently can be detrimental. Trained professionals possess the knowledge and experience to accurately interpret ECGs, recognizing subtle changes that might be missed by someone without medical training. Your doctor can synthesize the ECG findings with your medical history, symptoms, and other relevant information to provide a comprehensive diagnosis and treatment plan.
Navigating Your Next Steps: Engaging with Your Doctor
Schedule a Consultation: Discuss your ECG results with your doctor. They can provide a detailed explanation of the findings, address your questions, and alleviate any concerns you might have.
Discuss Lifestyle Modifications: Your doctor can recommend lifestyle adjustments — such as dietary changes, regular exercise, and stress management techniques — to promote optimal heart health.
Inquire About Further Investigations: If your doctor identifies any abnormalities on your ECG, they might recommend additional tests or procedures, such as an echocardiogram or stress test, to gain a more comprehensive understanding of your heart’s condition.
This guide aims to enhance your understanding of your heart health, enabling you to engage in more informed and productive discussions with your healthcare provider. Remember that a collaborative partnership with your medical team is crucial for maintaining and improving your cardiovascular well-being.
Decoding Specific ECG Abnormalities for Precise Diagnosis
Key Insights:
ECG interpretation is a systematic process that involves assessing heart rate, rhythm, and wave patterns.
Understanding the fundamental components of an ECG (P wave, QRS complex, ST segment, T wave) is essential.
Distinct abnormalities can indicate various underlying heart conditions.
Accurate interpretation depends on clinical context and expert judgment.
Self-diagnosing based solely on an ECG is risky; always seek guidance from a healthcare professional.
Unraveling the Heart’s Electrical Communication
Consider your heart as a finely calibrated engine, its rhythmic contractions powered by electrical impulses. An electrocardiogram (ECG or EKG) visually represents these electrical signals. Mastering how to interpret specific ECG abnormalities for accurate diagnosis is a gradual process, requiring consistent learning and attention to detail. How can we leverage ECG technology to achieve more reliable results?
Exploring the ECG Waveforms
The ECG tracing presents an array of waves and segments. Let’s center on the key components:
P wave: Depicts the electrical activation of the atria (the heart’s upper chambers).
QRS complex: Illustrates the electrical activation of the ventricles (the heart’s lower chambers)—the primary pumping chambers.
ST segment: Shows the early repolarization (recovery) phase of the ventricles. Changes in this segment often warrant significant attention.
T wave: Represents the completion of ventricular repolarization.
The intervals between these components – such as the PR interval (between P and QRS) and the QT interval (from QRS to T) – hold considerable diagnostic importance.
Spotting Common Abnormalities
Typical abnormalities detectable through an ECG include:
Heart rhythm irregularities (arrhythmias): These disrupt the regular heartbeat. For example, atrial fibrillation is characterized by chaotic P waves, while heart blocks manifest as delays or interruptions in electrical conduction.
ST segment deviations: Elevation can signal a heart attack (myocardial infarction), whereas depression may indicate ischemia (reduced blood flow).
Abnormal Q waves: These can suggest previous heart attacks.
Prolonged QT interval: This can increase the risk of potentially life-threatening heart rhythm disturbances.
How to interpret specific ECG abnormalities for accurate diagnosis necessitates meticulous attention to detail. Even subtle deviations can hold significant clinical implications.
The Critical Role of Context
Avoid the temptation to self-diagnose. Interpreting an ECG demands a holistic healthcare perspective. Your doctor will consider your medical history, symptoms, age, and results from other diagnostic tests in conjunction with the ECG data. This broader clinical context is vital for accurate interpretation. What elements constitute a comprehensive healthcare context?
A Simplified Step-by-Step Approach
While a complete ECG interpretation is intricate, here’s a simplified approach:
Assess Heart Rate: Count the number of QRS complexes within a 6-second ECG strip to determine the heart rate in beats per minute.
Evaluate Rhythm: Determine whether the R-R intervals (the distance between consecutive QRS complexes) are regular or irregular.
I am a writer specializing in health and lifestyle, committed to delivering well-researched, engaging, and insightful content. With a keen eye for trends and a deep understanding of health, presenting and exploring topics ranging from nutrition and mental health to sustainable living. This writing is solely intended to educate, inspire, and empower readers to live a healthier, more balanced life.